Digital employee experience (DEX) for Microsoft Intune: an experience score for every device

“My laptop is slow” is the hardest ticket on any service desk. There is no error code and no time stamp, and by the time an engineer looks, the problem has usually passed. Intune can tell you the device is compliant, encrypted and up to date. It was never built to tell you whether the device is actually working well for the person using it.
That is what digital employee experience (DEX) is about, and it is the heart of Eido 26.10. From 28 October 2026, every device running the Eido Client gets an experience score from 0 to 100 every night, and every score comes with the reasons behind it.
Digital employee experience, defined
Digital employee experience is how well a person’s devices and apps let them work: how long they wait at sign-in, how often an app crashes, whether the machine stalls because it is short of memory, whether the Wi-Fi drops. DEX tools measure that from the device itself, turn it into a score that can be compared across a fleet, and point to the cause.
For an Intune team the questions are practical. Which devices are giving people the worst time? Is it the laptop or the network? Which model, which Windows build, which app? And when we change a policy, do people notice?
What Intune measures on its own
Microsoft’s answer is Endpoint analytics, which “helps IT professionals assess and improve the user experience across managed devices” (Microsoft Learn: Endpoint analytics). It is worth knowing well, because it is good at what it sets out to do.
- Scores. The Endpoint analytics score is a weighted average of three others: Startup performance, Application reliability and Work from anywhere, each from 0 to 100 (Microsoft Learn: scores). Work from anywhere measures how far devices are configured for the cloud (Windows, cloud management, cloud identity and provisioning), not how they perform (Microsoft Learn: Work from anywhere).
- Startup. The startup score combines a boot score and a sign-in score, each from the device’s last boot and last sign-in, and keeps boot and sign-in events for 29 days. A Startup processes view lists processes that delay sign-in on at least 10 devices (Microsoft Learn: Startup performance).
- App reliability. Crashes and mean time to failure per app and per version, over the past 14 days (Microsoft Learn: Application reliability).
- Freshness. Data is processed every 24 hours, and Microsoft gives the maximum end-to-end latency as 96 hours (Microsoft Learn: data collection).
Microsoft 365 E3 and E5 now add more analytics on top of this, including resource performance and battery health. We compared those features with Eido, claim by claim, in a separate post.
What none of this covers is the network a device sits on. We found no Microsoft Learn page describing Wi-Fi signal, router latency or internet latency for physical devices; Windows 365 has a connection quality report for Cloud PCs only (Microsoft Learn: Cloud PC connection quality).
How Eido scores the experience
The Eido Client reads each measure once a minute on the device. Every night Eido works out a score for each device from its last 30 days, counting only days on which it was in use for an hour or more. A device needs three such days before it gets a score. The score has a grade: Good from 80, Fair from 60, Poor below that.
| Category | Share | What it is scored on |
|---|---|---|
| Performance | 30% | Time in use with the processor or memory at 85% or more, or the disk 80% busy, and input delay |
| Reliability | 25% | App crashes and hangs per 8 hours of use, blue screens and unexpected shutdowns |
| Network | 20% | A weak Wi-Fi signal and a slow internet connection; on a Cloud PC, the round trip and lost packets |
| Startup and logon | 15% | The median logon time and the median boot time |
| Device health | 10% | Battery health and the free space on the fullest drive |
Three details matter more than they look:
- Medians, not the last event. Logon and boot times use the median of the window, so one slow Monday morning does not sink a month.
- Missing data is left out, not counted as perfect. A desktop has no battery; its other measures simply count for more.
- One standard for everyone. The score is called Eido Standard and it is the same for every organisation, so it can be compared between devices, tenants and months. You can add a score of your own beside it, with your own weights, without losing the comparison.
From a score to a reason
A number on its own does not close a ticket. Click any day on a device’s score chart and Eido shows where the points went: a bar of 100 points, one colour per category, then every signal that cost points, worst first. When one app is behind the crashes, it is named.
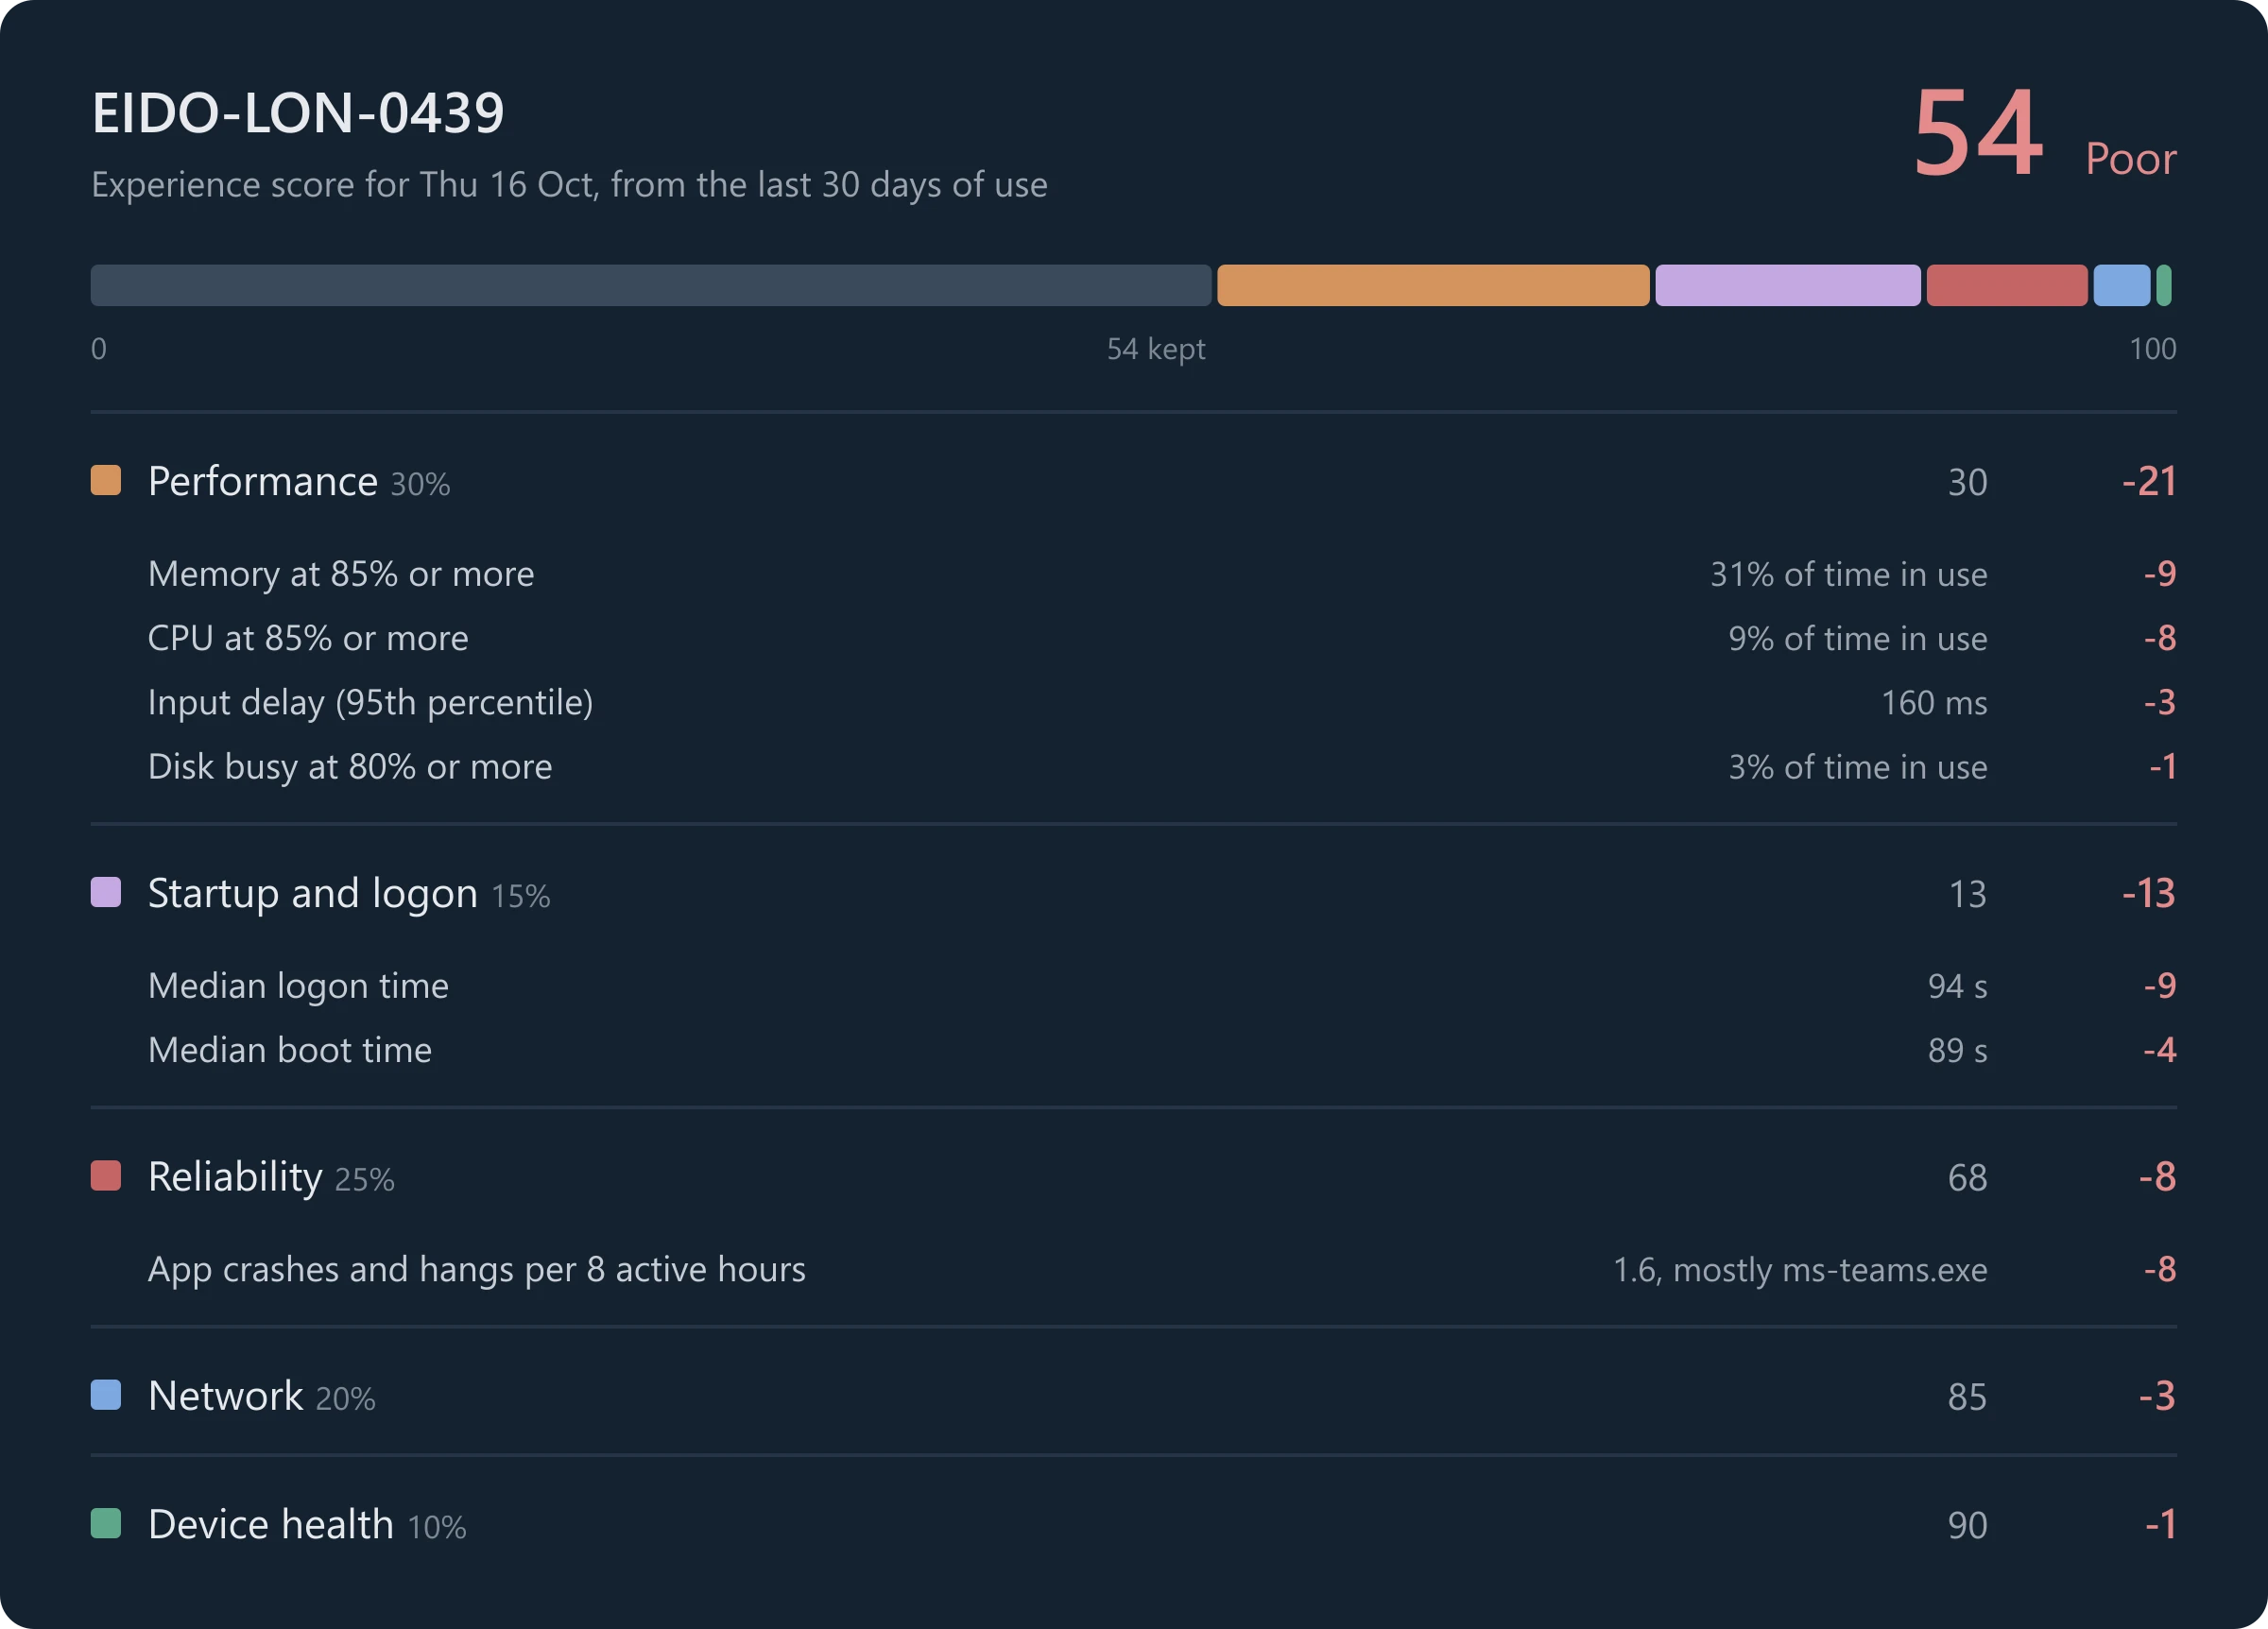
Underneath the score, the device keeps a record of problems. A problem starts when a reading stays past a threshold for a set number of minutes, so a single busy minute never turns anything red. Each one records when it started, how long it lasted, its peak, the apps using the most at the time, and whether the device was on Wi-Fi, on the VPN, on battery or idle. Show me charts the problem from 30 minutes before it began to 30 minutes after it ended.
The Experience page puts it together across the fleet: the 30-day average and its trend, how scores are spread, which categories and signals cost the most points, and the ten lowest devices. Almost every figure opens the devices behind it, ready to export or to take into Query Hub.
The laptop, the Wi-Fi, the router or the internet
The question users ask most is whether the problem is their machine or the network. Eido answers it with one row at the top of the device’s Monitoring page: Device, then Wi-Fi or Ethernet, then Gateway (the router), then Internet, each in the colour of its stage with its latest reading. A VPN tag appears when traffic goes through one, which often explains a slow connection.
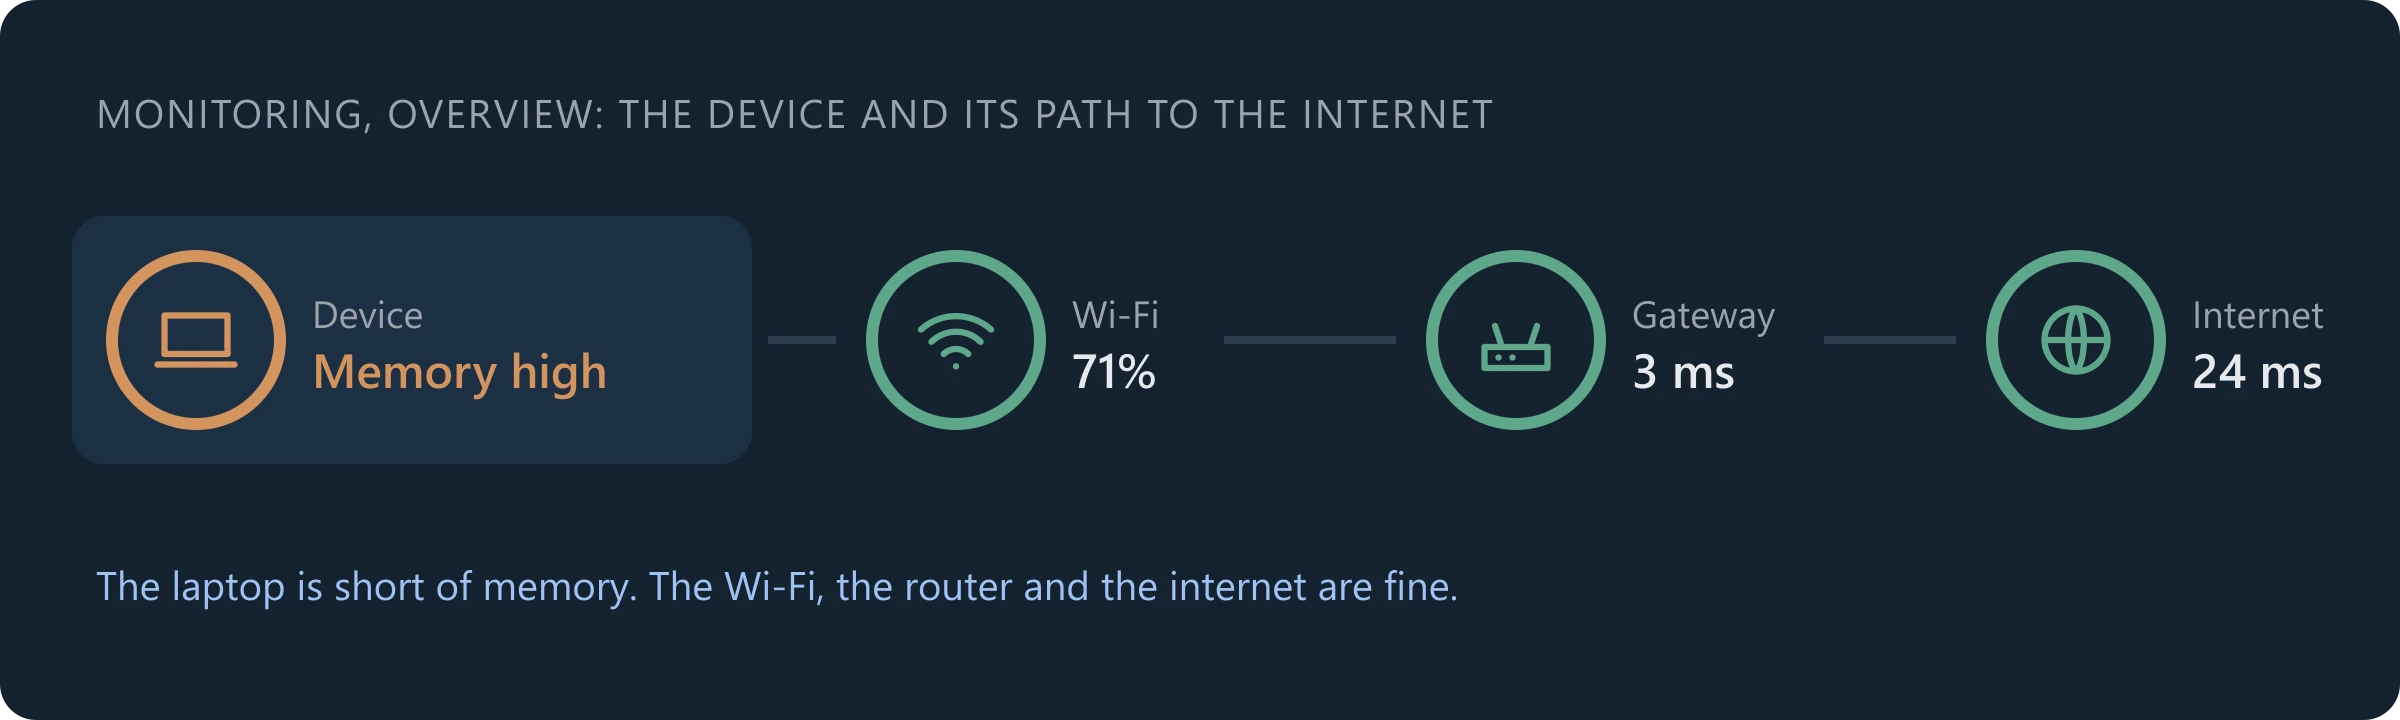
The measures behind it are plain:
- Wi-Fi signal and channel use from Windows’ own Wi-Fi interface.
- Time to reach the router, from one small test message to the default gateway each minute.
- Time to reach the internet, from a ping to Google Public DNS every five minutes. Google answers from a site near the device, so it measures the device’s own connection, and it takes two slow checks in a row to open a problem.
- On a Windows 365 Cloud PC, the round trip and lost packets of the connection to it.
Every logon and every boot, timed
Slow sign-ins are the complaint people make most often and the hardest to prove. Eido records every logon on each device for 30 days, split into Profile, Group Policy, Desktop and Other, with the slowest steps Windows ran. First logons, which always take longer, are marked as such. Every boot is recorded too, split into start-up and after the sign-in screen, with what Windows says held it up: a driver, a service or an app, and how long it added.
Across the fleet that becomes reports such as Logon Time by Model, Logon Time by OS Build, Group Policy-Heavy Logons and What Slows Boots Across the Fleet.
Did that Intune change make things worse?
This is the part we are proudest of. Change Impact takes each change to an Intune policy, its settings or its assignments, and looks at the devices it reached. It compares their scores, logon times and crash rates over the 7 days before the change with the 7 days after, against the rest of the tenant over the same days, so a bad week for everybody is not blamed on the change.
Each change gets a verdict:
- Worse when the score of the devices it reached fell by 3 points or more beyond the other devices’, or their logons got 20% slower.
- Better for the opposite.
- No effect otherwise.
- Not enough data when fewer than 5 of the devices it reached have a score before and after.
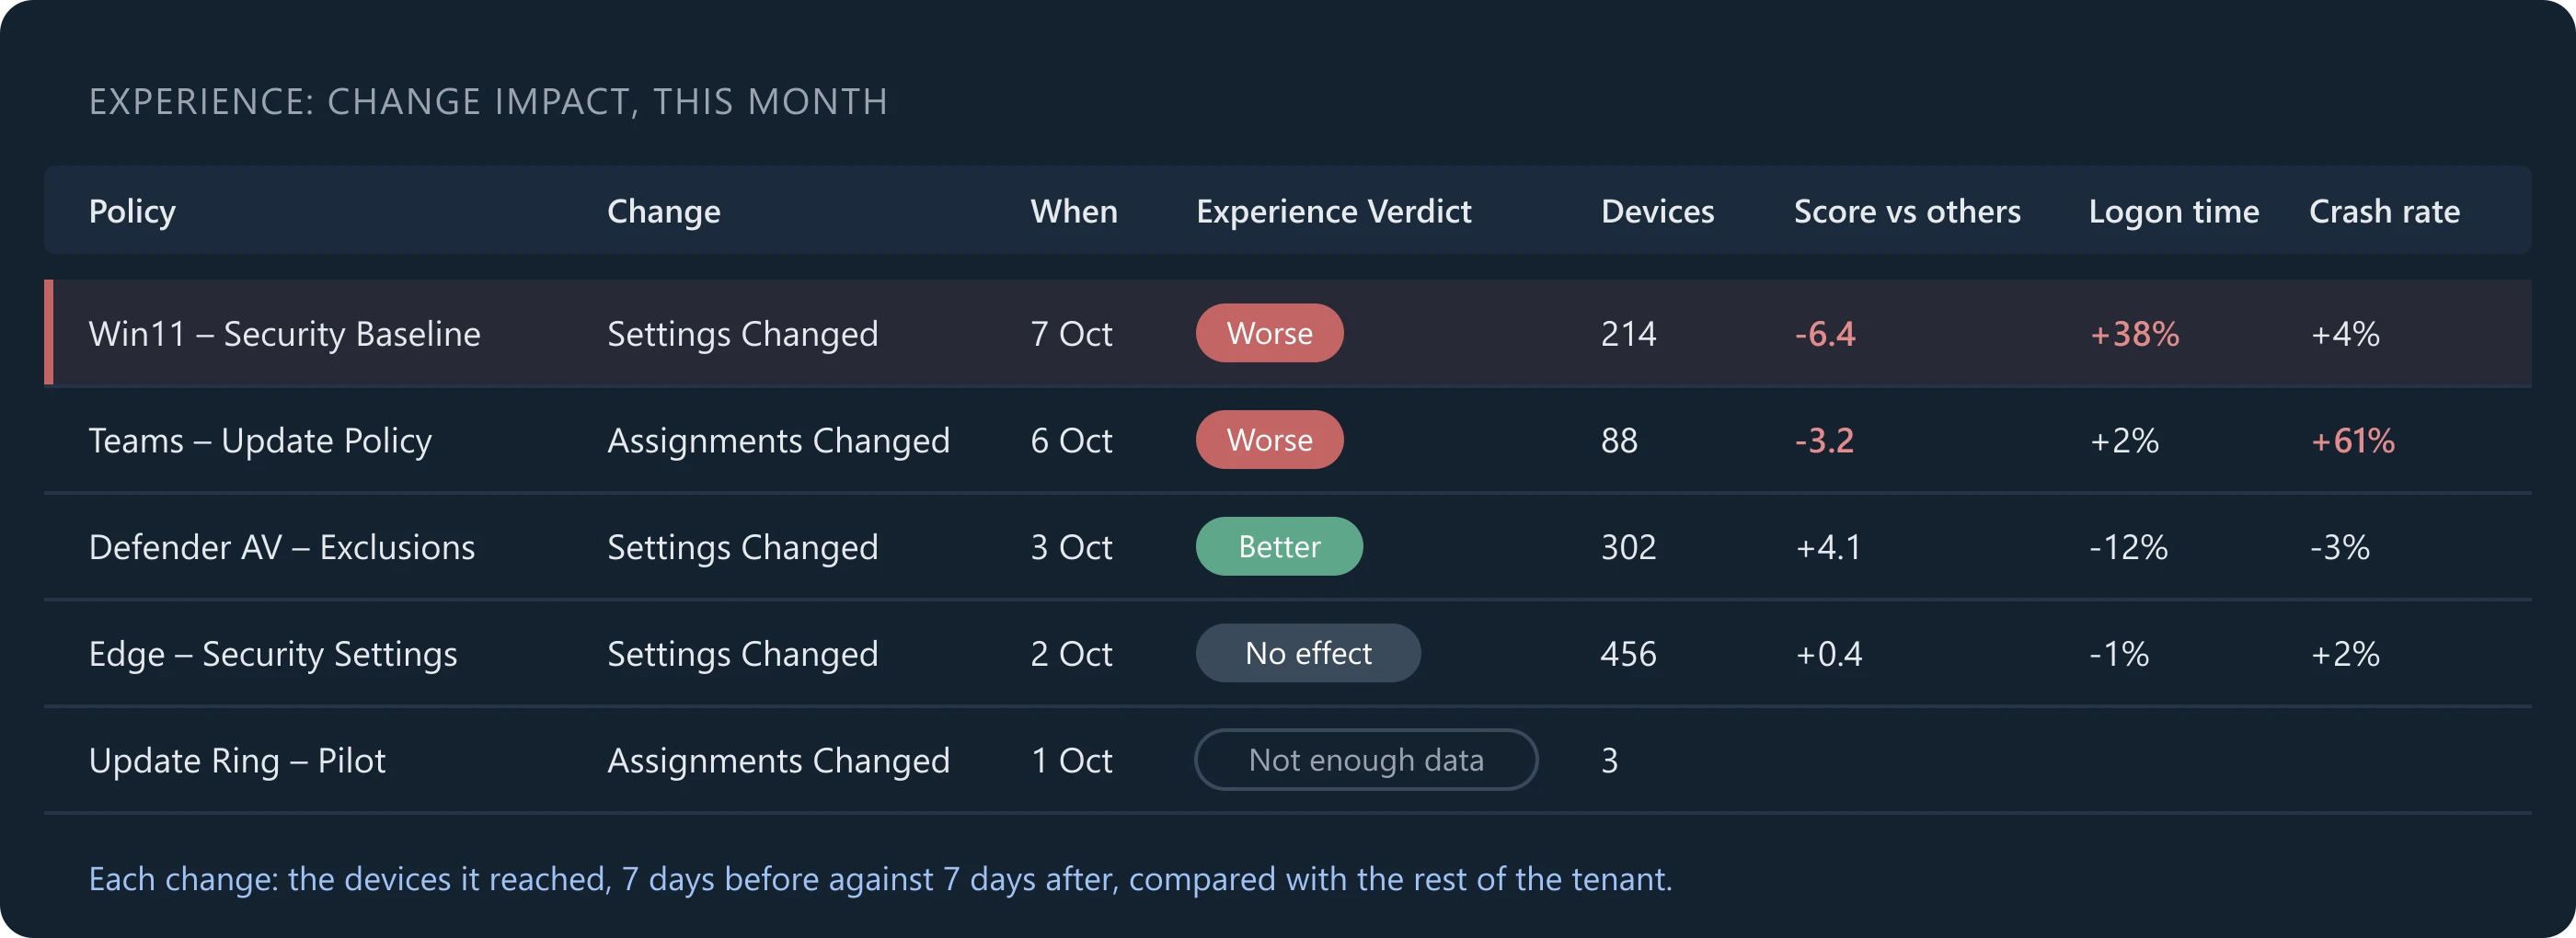
It is a comparison, not proof, and we say so in the product: something else can happen to the same devices in the same week, and assignment filters are not taken into account. But it turns “did anyone notice that baseline change?” from a guess into a report you can filter by policy or by who made the change.
Intune’s audit log records who changed a policy and which properties changed (Microsoft Learn: audit logs). Microsoft’s anomaly detection in the E3 and E5 analytics looks for jumps in app crashes, hangs and stop errors after configuration changes, with predetermined thresholds (Microsoft Learn: anomalies). Change Impact adds the experience score and logon times to that picture, for every change.
Your thresholds and your score
Every reading is placed on one of five stages: Healthy, Low, Medium, High and Critical. Out of the box only High and Critical are on, at thresholds such as 85% memory in use for High and 95% for Critical. Administrators can change any threshold, switch stages on, and leave out apps, drives or Wi-Fi networks, for every tenant or for one tenant, one group or one device. The same profiles carry any Windows performance counters you want to chart, and those can raise problems too.
Reports, dashboards and Odie
Digital experience arrives with nine Experience views in Query Hub and 33 built-in reports in a new Digital Experience category, from Devices with a Problem Right Now to Experience Score by Model and Changes That Hurt Experience. Like every Query Hub view, they work in dashboards, scheduled email, workbooks, export jobs and automations.
Or ask Odie, Eido’s assistant. “Why is this device scoring 52?” gets the categories and signals that cost it points. “Did any Intune change make experience worse this month?” gets a report (what to ask Odie).
What stays on the device
The minute-by-minute readings stay on the device, for seven days. Eido keeps only what the device works out from them: the stage of each area, the problems and a daily summary, and the score it calculates from those. Recording who signed in is a separate switch, so you decide whether Eido keeps user names.
Eido and Endpoint analytics, side by side
| Intune Endpoint analytics | Eido digital experience | |
|---|---|---|
| Score | Weighted average of startup, app reliability and Work from anywhere | 0 to 100 from performance, reliability, network, startup and device health |
| Startup | Last boot and last sign-in; 29 days of events | Median logon and boot over 30 days; every logon split into phases |
| Network | Not described for physical devices | Wi-Fi, router, internet and VPN, plus Cloud PC connections |
| Freshness | Processed every 24 hours, up to 96 hours end to end | Readings every minute on the device; stages sent every 5 minutes; scored nightly |
| Cause | Startup processes affecting 10+ devices; app crashes by version | Points lost per signal per day, top apps during each problem, Show me |
| Policy changes | Audit log of who changed what | A verdict for every change on the devices it reached |
| Customising | Baselines to compare against | Your own thresholds, stages and score, per tenant, group or device |
Endpoint analytics is included with Intune and is worth switching on. Eido sits alongside it, and adds the network, the minute, the reason and the policy change.
Getting started
Digital experience is part of the Eido Client and is switched on per tenant in the client’s settings. Devices need Eido Client 1.1.40 or later. If a tenant already uses the Eido Client’s monitoring, digital experience is switched on for it with the release. A device gets its first score the morning after its third day of use.
It is included in the one Eido plan, priced per device, per year (pricing). See the whole feature on the product page, or book a demo and we will show you the scores on your own devices.
Common questions
What is a good digital experience score?
Eido grades 80 and above as Good, 60 to 79 as Fair and below 60 as Poor. Because Eido Standard is the same everywhere, the more useful comparison is often your own trend, and which categories cost your fleet the most.
Does DEX need an agent?
Yes. The readings come from the Eido Client on each Windows device, an MSI most teams deploy as a Win32 app through Intune. Eido’s reporting, patch compliance and software metering need no agent.
Which devices does it cover?
Windows devices running the Eido Client, including Windows 365 Cloud PCs, whose connection quality is scored in place of the Wi-Fi and the internet.
How is this different from the analytics in Microsoft 365 E3 and E5?
Those add fleet-level resource performance, battery health and device query to Intune. Eido adds the network path, minute-level problems with the apps behind them, logon phases, change impact and a score you can tune. Our full comparison goes through each one with Microsoft’s documentation linked.