.png)
Live Device Intelligence for Microsoft Intune
Intune tells you what happened. Eido tells you what's happening.
.png)
3 sec
metric sampling
350+
inventory data points
3,000+
performance counters
15 min
inventory refresh
A lot can happen between Intune check-ins. By the time a support ticket reaches your team, the problem may already have disappeared.
Eido gives you a live view of the device, so you can see what's happening, spot recurring issues and investigate without asking the user to recreate the problem.
Intune
Intune + Eido
Device inventory
Hours, or days out of date
Updated every 15 min
Live performance
Not Available
3-second granularity &
3000+ Counters available
Device events
Limited
Seen as they happen
Support tools
Remote session needed
Act from the device page
Eido Client adds live performance, deeper device information, events and support tools to your existing Intune environment. Open a device in Eido and you have the context you need to investigate from one place.
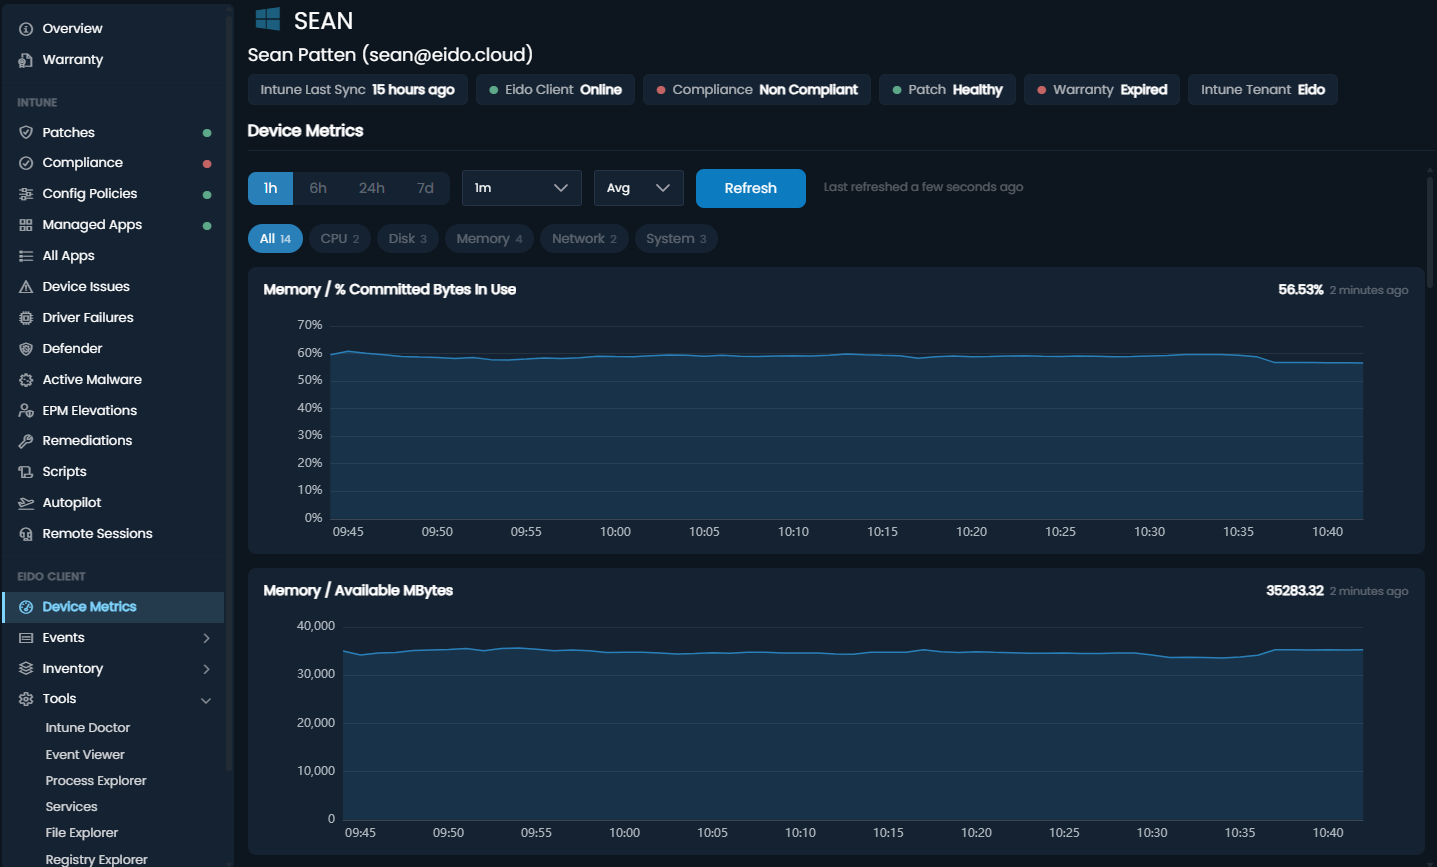
See CPU, memory and disk behaviour while the issue is happening, with detail down to three seconds. Diagnose intermittent problems without waiting for another check-in or asking the user to recreate them.
See apps, patches, hardware and key configuration details from one place, refreshed as often as every 15 minutes. Useful for support, audits, rollouts and device refresh planning.
See application crashes, blue screens and hardware errors as they happen. Spot recurring problems earlier and investigate with the relevant device context already there.
Check processes, services, event logs, files and more from the device page. Resolve common issues without taking over the user's screen.
Open the device, see what's wrong and take action from the same page. Restart a service, inspect an event log, clear a stuck print queue or check a running process without starting a remote session or interrupting the user. Access is controlled per customer, with write actions disabled by default.
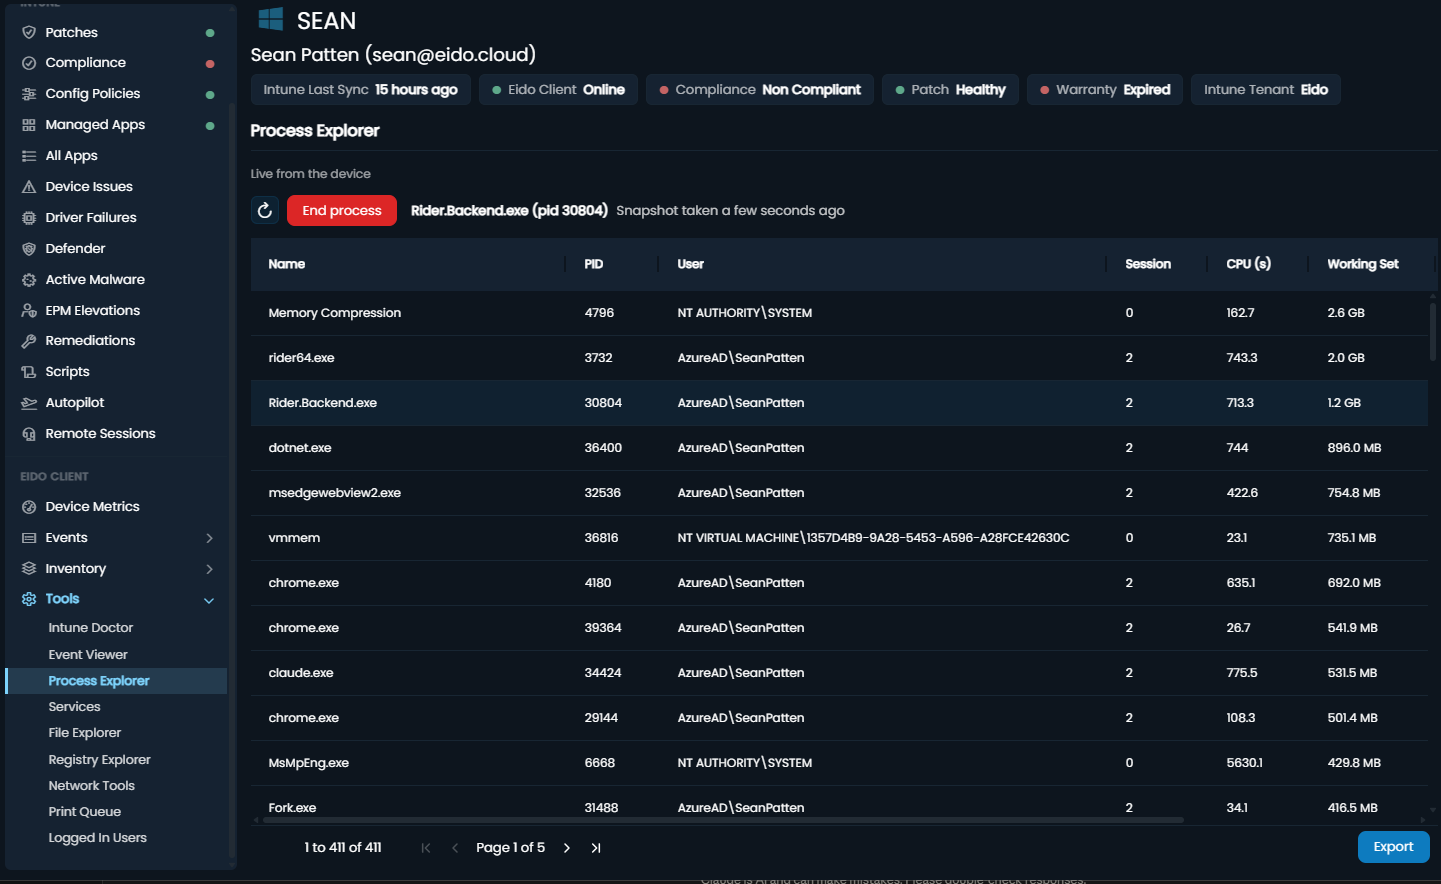
Intune Doctor
Diagnose Intune enrolment health and trigger an OMA-DM sync
Process Explorer
See all running processes, end a process
Services
Start, stop and restart Windows services
Registry Explorer
Browse and edit the registry, create and delete keys and values
Event Viewer
Browse and query any Windows event log channel
File Explorer
Browse the file system, read-only
Print Queue
View queue status, cancel jobs, purge the queue
Logged-in Users
See logged-in users, disconnect or log off sessions
Network Tools
Ping, traceroute, DNS lookup and netstat from the device
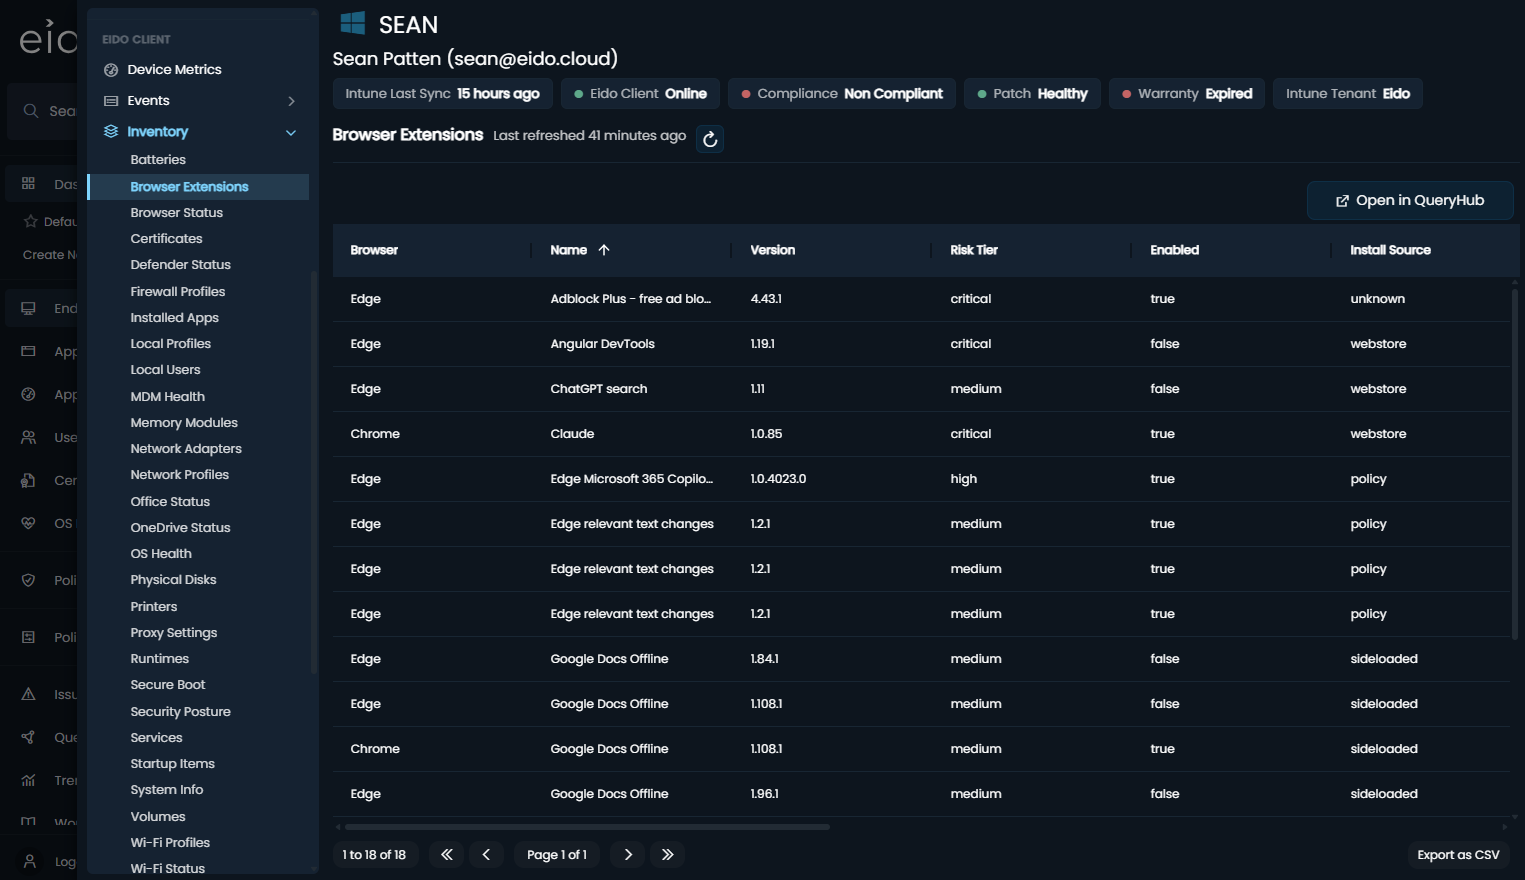
Get a current view of hardware, software, security and configuration across your Windows estate, with inventory refreshed as often as every 15 minutes. When you're troubleshooting an issue, planning a rollout or answering an audit question, the information is already there.
Hardware & OS
System info
Model, serial, CPU, RAM, TPM, BIOS
OS health
Build, install date, pending reboots
Volumes
Size, free space, BitLocker status
Physical disks
Every drive and its health
Memory modules
DIMMs, slots and sizes
Battery
Health and wear at a glance
Windows features
Optional features switched on
Network
Network adapters
IPs, MACs and DNS in one place
Network profiles
Public, private or domain
Proxy settings
Where traffic is really going
Wi-Fi status
Current connection and signal
Wi-Fi profiles
Every saved network on the device
Software
Installed apps
Every app and version, estate-wide
Services
How each service is configured
Runtimes
.NET, VC++ and Java versions
Browsers
What's installed and how old
Browser extensions
Spot the risky ones fast
Office
Install type, version and channel
OneDrive
Client health and sync state
Startup items
What launches at boot
WSL
Linux subsystems and distros
Printers
Installed printers and drivers
Security & Identity
Security posture
Hardening state across the estate
Defender
Signatures and protection state
Firewall profiles
On, off, and how they're set
Certificates
Catch expiries before they bite
Local users
Who has an account, who's admin
User profiles
Profiles on disk and their size
Intune enrolment
MDM health, before sync breaks
Live device access is designed around control and least privilege. Read-only is the default, sensitive actions require additional authentication and remote changes are logged.




Write actions stay off until you deliberately switch them on, per customer
Risky actions force a fresh Entra ID sign-in before they run
Every device authenticates with its own non-exportable certificate, no shared secrets
The agent refuses to touch Defender, the firewall and critical system processes
Repeated failures or suspicious activity shut the channel down automatically
Every remote action is logged: who ran it, on which device, and when
It ships as an MSI, so most teams push it as a Win32 app through Intune. GPO, RMM tools or a manual install work too. Enrolment uses a one-time token, and from then on the device identifies itself with its own certificate. No passwords or shared secrets are stored on the endpoint.
Outbound only. The Eido Client doesn't accept inbound connections. Platform traffic uses secure HTTPS, while live metrics use secure Azure IoT connectivity. If the live metrics connection is blocked, the rest of Eido continues to work.
Eido Client is designed to have minimal impact on the device. Normal sampling is lightweight and increases only while somebody is actively viewing live performance. Live metrics are requested on demand rather than continuously uploaded.
No. Intune remains responsible for device management, policy and configuration. Eido Client adds the live visibility and support tools that sit alongside it, so you can see more of what's happening on the device and act faster when something goes wrong.
You choose a region at onboarding: UK, EU or US, and your data stays in that region. Recent performance history is held on the device itself, and event history is retained in the platform.
AI diagnostics can only run approved, verified scripts from a controlled library. There is no free-form command line, and every execution is logged, rate-limited and subject to the same device protections as other live actions.


